Follow Us
Join our newsletter


By Niccolo Conte Graphics/Design: Christina Kostandi | Clayton Wadsworth
Visualizing the Metals you can Buy with $1,000
For millennia people have purchased and relied on metals for decorative and industrial uses, figuring out their values based on their practical applications and visual luster.
Today, precious and industrial metals markets quote figures in millions and billions as they exchange thousands of ounces, with varying densities and values of metals making it difficult to compare them.
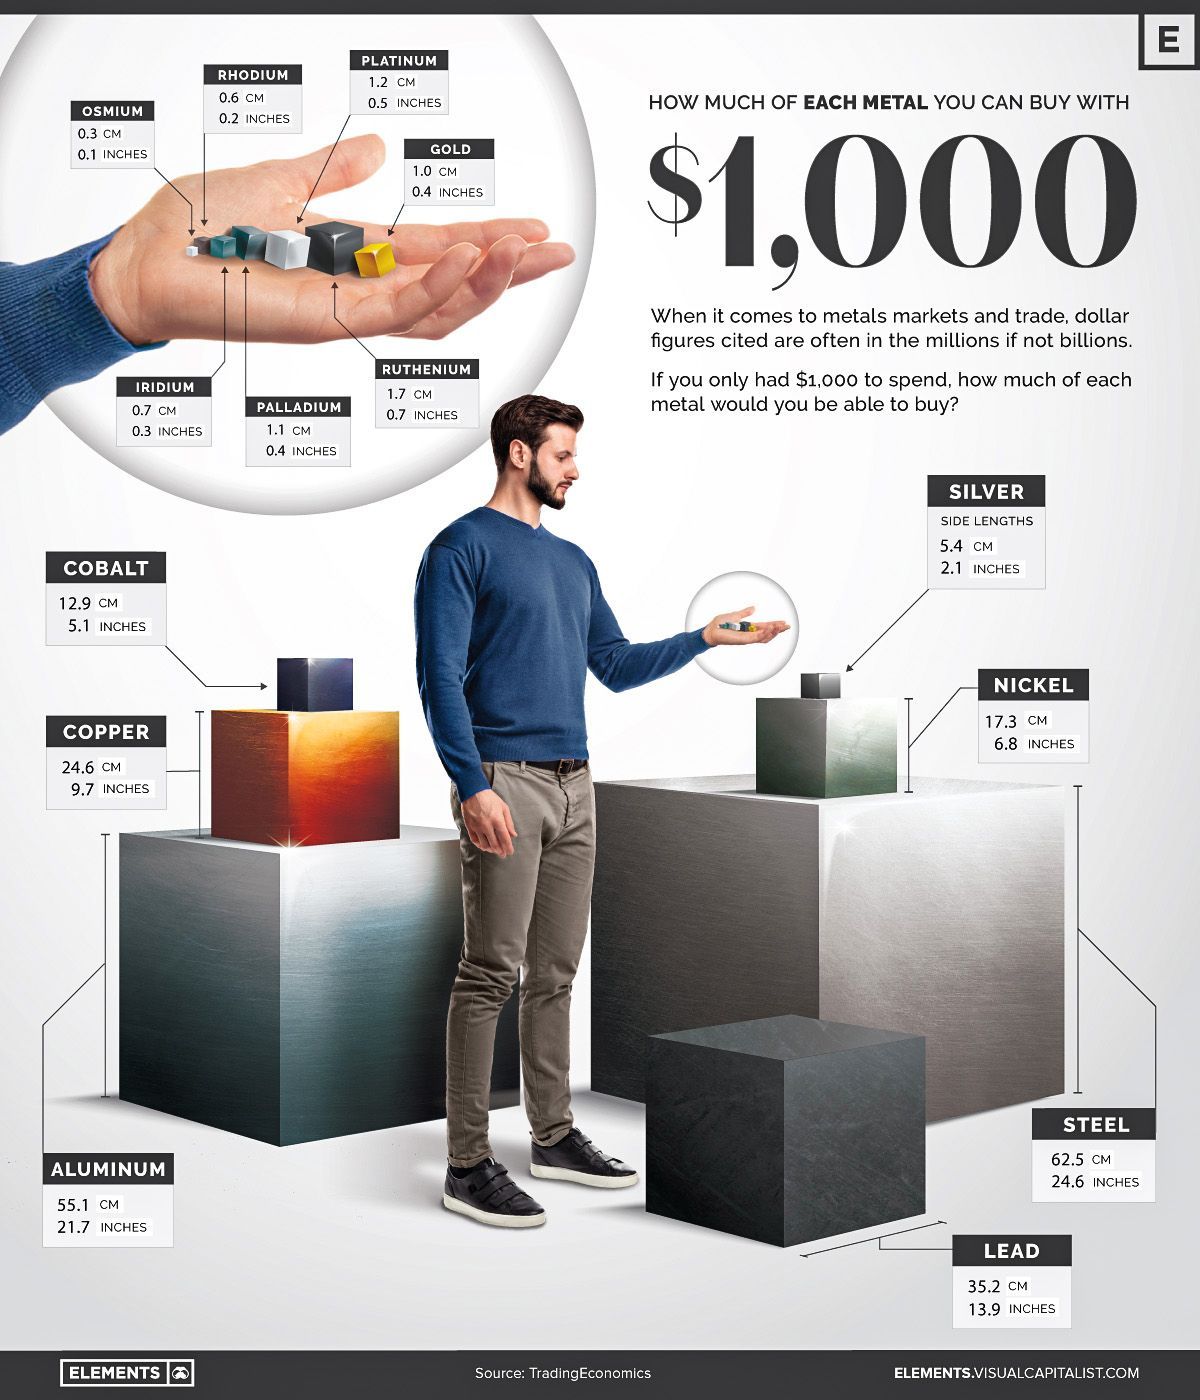
Using price data from TradingEconomics, this graphic visualizes how much of each metal you can buy for $1,000 so you can see just how much, or how little, of each metal you get for your money.
How we Value Precious and Industrial Metals
Characterized by their natural shine, metals are valued using the two key principles of rarity and their industrial uses, with unique properties such as their appearance or cultural significance also affecting their value.
- Rarity: A more scarce metal or resource will often have a higher value than one which is more abundant.
- For example, while there are an estimated 2.1 billion tonnes of identified copper deposits, there are only 57,000 tonnes of underground gold reserves. While copper is valued at $0.24 per troy ounce, gold is worth around $1,815 per troy ounce.
- Industrial uses: Metals which are needed for important industrial processes will often have a high demand from manufacturers, increasing their valuation.
- For example, for most of its history cobalt was used decoratively for its striking blue color and for the creation of superalloys and steel products. However, when it was recently discovered that cobalt could be a key component in lithium-ion batteries for EVs, demand for cobalt surged sending its price from around $23,000 per tonne to more than $90,000 per tonne at one point.
Along with these two primary factors, unique properties and historical uses can also affect a metal’s valuation.
Former monetary metals like gold and silver are still sought after by investors for their potential ability to retain value over time compared to today’s fiat currencies. Meanwhile, platinum’s durability, resistance to tarnishing, and its bright white color makes it highly sought after for jewelry, raising the demand and value of the precious metal.
Getting Less for More: Comparing Metal Density
A key factor that determines the volume of a metal you get for a certain price is also the metal’s density. Precious metals tend to be more dense than industrial metals, with sometimes more than double the density depending on the specific metals compared.
As seen in the graphic above, $1,000 worth of highly dense metals like gold (19.32 g/cm³), iridium (22.56 g/cm³), and osmium (22.59 g/cm³) amount to small cubes less than a centimeter across. Meanwhile, $1,000 of a less dense (and also less valuable) metal like aluminum with a density of only 2.7 g/cm³ yields a large cube nearly two feet tall.
To put these densities in comparison, if gold had the same density as aluminum, its cube on the graphic above would be more than seven times larger.
While it’s impossible to directly compare the value of each metal’s industrial uses and applications, seeing just how much (or how little) of a metal you get for $1,000 can give some perspective to their value.
Copyright © 2024 Visual Capitalist

Contact
info@vvcresources.com
2369 Kingston Road, PO Box 28059 Terry Town, Scarborough, ON M1N 4E7 Canada
About
Projects
Sign up to receive updates on VVC announcements, launches, and opportunities.